Note
Go to the end to download the full example code or to run this example in your browser via JupyterLite.
Affine invariance#
In this examples, we will compare the robustness of the three feature selection methods on affine transformed features.
# Authors: The fastcan developers
# SPDX-License-Identifier: MIT
Initialize test#
The three feature selection methods, i.e., OMP, OLS, and FastCan,
will select three features from the 10 features of diabetes dataset. It can be
seen, the three methods select the same features.
import numpy as np
from sklearn.datasets import load_diabetes
from sklearn.linear_model import OrthogonalMatchingPursuit

from fastcan import FastCan
from fastcan.utils import ols

X, y = load_diabetes(return_X_y=True)

n_selected = 3
omp_selector = OrthogonalMatchingPursuit(n_nonzero_coefs=n_selected)
fastcan_selector = FastCan(n_features_to_select=n_selected, verbose=0)
(ids_omp,) = omp_selector.fit(X, y).coef_.nonzero()
ids_ols, _ = ols(X, y, n_selected)
ids_fastcan = fastcan_selector.fit(X, y).indices_

print("Indices of features selected by:")
print("OMP: ", np.sort(ids_omp))
print("OLS: ", np.sort(ids_ols))
print("FastCan: ", np.sort(ids_fastcan))
Indices of features selected by:
OMP:  [2 3 8]
OLS:  [2 3 8]
FastCan:  [2 3 8]
Affine transformation#
In this test, the 10 features of diabetes dataset will be randomly polluted
by the affine transformation. The three feature selection methods will select
three features from the polluted features. The more stable the result, the better.
n_features = X.shape[1]
rng = np.random.default_rng()

ids_omp_all = []
ids_ols_all = []
ids_fastcan_all = []
for i in range(10):
    X_affine = X @ np.diag(rng.random(n_features)) + rng.random(n_features)

    (ids_omp,) = omp_selector.fit(X_affine, y).coef_.nonzero()
    ids_ols, _ = ols(X_affine, y, n_selected)
    ids_fastcan = fastcan_selector.fit(X_affine, y).indices_
    ids_omp_all += ids_omp.tolist()
    ids_ols_all += ids_ols.tolist()
    ids_fastcan_all += ids_fastcan.tolist()
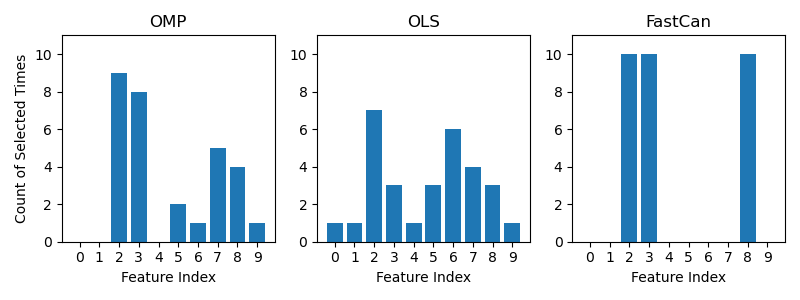
Plot results#
It can be seen, only FastCan has robust results when the feature
is polluted by the affine transformation.
import matplotlib.pyplot as plt

bin_lims = np.arange(n_features + 1)
counts_omp, _ = np.histogram(ids_omp_all, bins=bin_lims)
counts_ols, _ = np.histogram(ids_ols_all, bins=bin_lims)
counts_fastcan, _ = np.histogram(ids_fastcan_all, bins=bin_lims)

fig, axs = plt.subplots(1, 3, figsize=(8, 3))

axs[0].bar(bin_lims[:-1], counts_omp)
axs[0].set_xticks(bin_lims[:-1])
axs[0].set_ylim((0, 11))
axs[0].set_title("OMP")
axs[0].set_xlabel("Feature Index")
axs[0].set_ylabel("Count of Selected Times")


axs[1].bar(bin_lims[:-1], counts_ols)
axs[1].set_xticks(bin_lims[:-1])
axs[1].set_ylim((0, 11))
axs[1].set_title("OLS")
axs[1].set_xlabel("Feature Index")

axs[2].bar(bin_lims[:-1], counts_fastcan)
axs[2].set_xticks(bin_lims[:-1])
axs[2].set_ylim((0, 11))
axs[2].set_title("FastCan")
axs[2].set_xlabel("Feature Index")

plt.tight_layout()
plt.show()
Total running time of the script: (0 minutes 0.230 seconds)